Plot silhouette scores across k values for a cluster_bouquet result
Source:R/cluster_bouquet.R
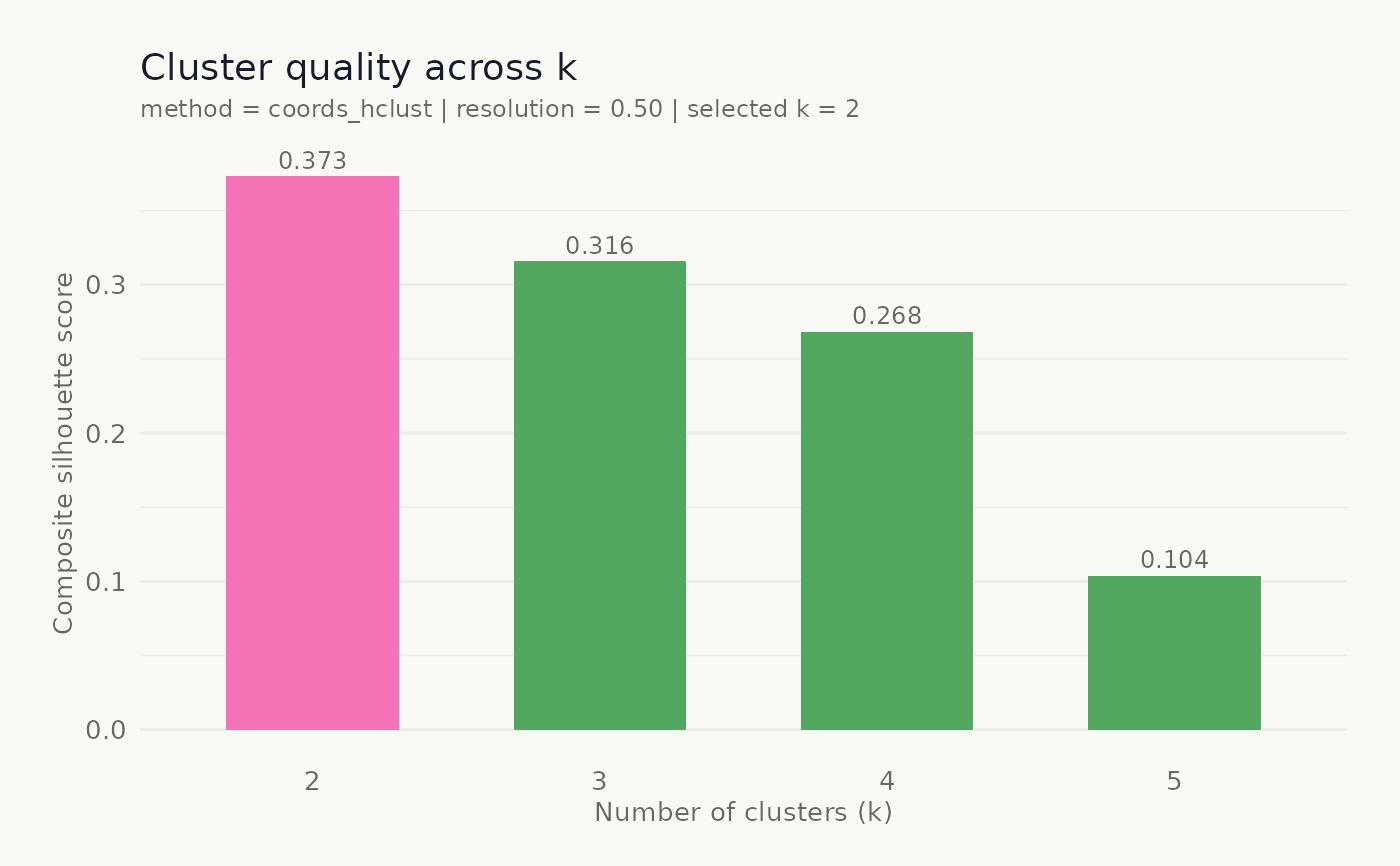
plot_cluster_quality.RdDraws a bar chart of the composite silhouette score (or plain mean
silhouette if resolution = 0) across all candidate k values evaluated
during automatic k selection. The selected k is highlighted. Use this to
inspect the elbow and decide whether a different k might be preferable.
Arguments
- x
A
cluster_bouquetobject returned bycluster_bouquet().- dark_mode
Logical. Match the dark background of
make_plot_bouquet(). DefaultFALSE.
Value
A ggplot2::ggplot object (invisibly), also printed to the device.
Details
This function requires that cluster_bouquet() was called with
k = "auto" – if a fixed k was supplied there are no scores to plot.
Examples
# \donttest{
set.seed(42)
n <- 52L
gw <- tibble::tibble(
  week    = rep(seq(as.Date("2023-01-01"), by = "week", length.out = n), 6L),
  station = rep(paste0("S", 1:6), each = n),
  level   = c(cumsum(rnorm(n)), cumsum(rnorm(n)), cumsum(rnorm(n)),
              cumsum(rnorm(n)), cumsum(rnorm(n)), cumsum(rnorm(n)))
)
result <- cluster_bouquet(gw, week, station, level)
plot_cluster_quality(result)

# }
# }